Graphing your CruiseControl build times with Gruff
• Julian Simpson
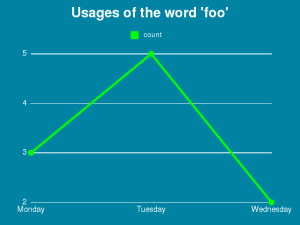
data = { "count" => [ 3, 5, 2 ] }
g = Gruff::Line.new 640
g.title = "Usages of the word 'foo'"
g.labels = { 0 => 'Monday', 1 => 'Tuesday', 2 => 'Wednesday'}
g.theme_rails_keynote
data.each_pair {|k, v| g.data(k, v)}
blob = g.to_blob
out = File.new("blob.png","w+")
out < blob
This code uses Gruff to actually generate the chart, and you'll need to install this separately. Pass it some data and it will build a PNG file with your graph. By plumbing it into the radiator, the trend in build times is visible to the entire room. It really helped to keep the team focussed on the length of the build - especially for browser based tests that can easy start to slow things down.